Monitoring
Contents
Headline
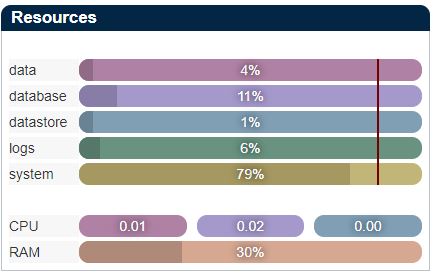
The Tranzman Dashboard provides the ability to check state of Environments, Tranzman Resources(CPU, RAM, Tranzman specific filesystems), Migration State, Service Status , Progress and Config Migration. Tranzman UI is very flexible as it enables end user to perform majority of migration related steps through UI.
Tranzman Resources
This section enables you to monitor:-
- Filesystem utilization.
- CPU utilization.
- Memory utilization.
Environments Details
This sections enables you to check different backup environment related components. e.g. Number of backup images i.e #Img Count<\b>, amount of backup data <b>#Size Protected(TB),platform etc.
Main highlight is the state of Environment. If the environment state is then it implies that something has gone wrong on that backup environment during transition and needs to
be resolved.The Views section on the sidebar can further help you dig further to find the root cause or to Contact Stone Ram Support for further assistance.
