Reporting and Logging
From Tranzman Documentation
Contents
Reporting & Logging in Tranzman Appliance
Tranzman provides extensive logging and reporting for all migration activities.
Reports help track migration status, troubleshoot issues, and audit migrated components.
Access reporting features from Views → Reports in the web console.
Reports Overview
-
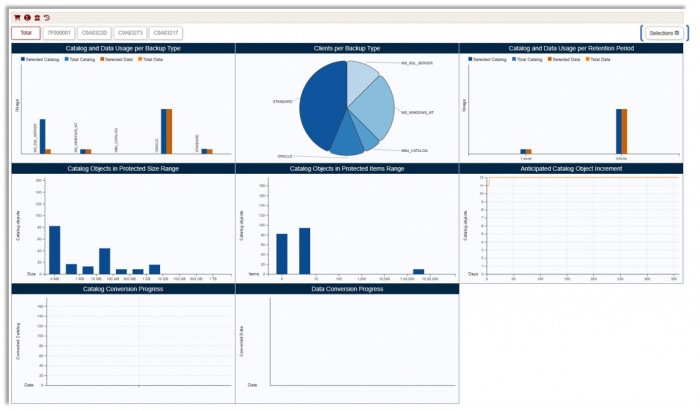
Reports provide statistical charts on image catalog and related information.
Reports are available for individual environments or as a collective view.
Use the Selections button (top right) to filter charts. -
 Charts for selected migration data.
 Charts for non-selected data.
 Charts for both selected and non-selected data.
-
Example: Charts for selected data.
-
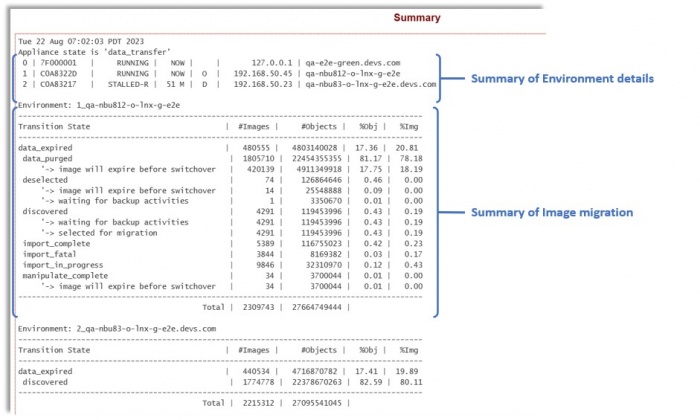
Summary and Environment History reports are available.
Click for Summary.
-
Summary Report shows:
- Tranzman appliance state (e.g., configuration_migration, data_transfer, completion)
- Agent connection status (RUNNING or STALLED)
- Time since last agent connection
- Agent role: Origin (O), Destination (D), finalized (Of/Df)
-
Image State Details:
- data_expired: Images expired
- data_purged: Images migrated to destination
- deselected: Images deselected (e.g., Catalog backup)
- discovered: Images discovered on server
- export_complete: Exported images
- export_in_progress: Export in progress
- export_fatal: Export failed (Origin troubleshooting)
- manipulate_complete: Images updated for import (stored on /data)
- manipulate_in_progress: Images being updated
- import_complete: Migrated images
- import_in_progress: Import in progress
- import_fatal: Import failed (Destination troubleshooting)
-
Environment History: Click
 for environment history.
Alerts & Activities
-
Alerts: View all issues identified during transition.
Shows time, Task ID, category, and description.
-
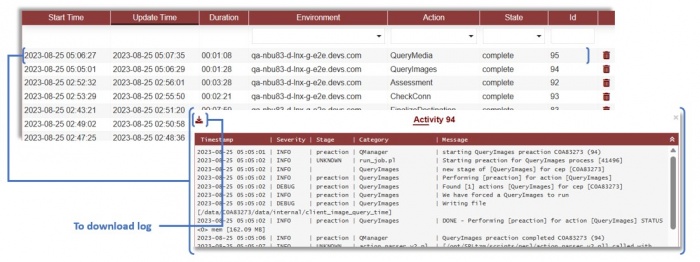
Activities: Shows all job information.
Click a job for task details; download logs for troubleshooting.
Images Management
-
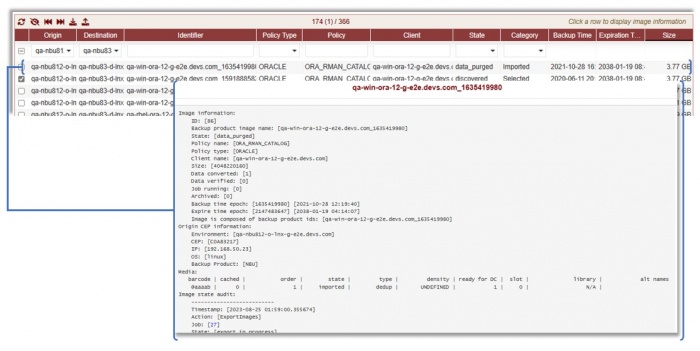
View all discovered images for backup domains.
Manipulate migration: ignore, reset, force import, etc.
Click an image for details and audit stages.
- Image actions:
-
Filters: Origin, Destination, Policy Type, State, Category, and custom text.
All dropdowns support multi-selection; default is no filter.
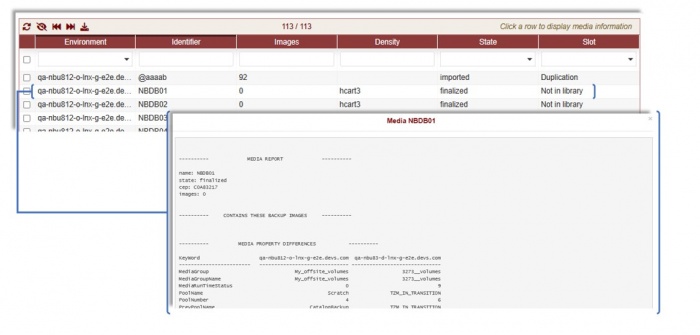
Media Management
-
Access media info under Views → Media.
Filter media as needed.
-
Media Report:
---------- MEDIA REPORT ---------- name: NBDB05 state: finalized cep: C0A83217 images: 2 -
Images in Media:
---------- CONTAINS THESE BACKUP IMAGES ---------- qa-nbu812-o-lnx-g-e2e.devs.com_1692928837 qa-nbu812-o-lnx-g-e2e.devs.com_1692928878 -
Media Property Differences:
---------- MEDIA PROPERTY DIFFERENCES ---------- KeyWord qa-nbu812-o-lnx-g-e2e.devs.com qa-nbu83-d-lnx-g-e2e.devs.com ------------------------ ------------------------------ ------------------------------ AssignedDateTime 2023-08-25 02:00:37.000000 1970-01-01 00:00:00.000000 ... -
Rules Applied in Media:
---------- RULES ---------- TYP| RULE ID| MAP ID| ORIG| DEST|ORDER| CRITERIA|OPERATION| MATCH| RESIDENCE| DEVICE EME| 3| 2| C0A83217| C0A83273|10001| all| =| all| N/A| N/A ---------------------------------------------------------------------------------- -
Media State Audit:
-------------------------- Media state audit: -------------------------- Timestamp: [2023-08-25 02:07:18.879454] Action: [CreateMedia] Job: [38] State: [imported] Reason: [Changed to imported] ... - Media actions:
Config Objects
-
Lists all available configuration objects for migration.
Shows status: selected, deselected, imported, not selected.
Filter options available under Views → Config Objects. -
States:
- deselected: Excluded by rules in Selections
- exported: Available on Origin
- imported: Migrated to Destination
- not selected: Auto-selected, not in rules
- selected: Selected via Selections or Rules
