Monitoring
Contents
Introduction
The Tranzman dashboard gives an overview of the progress and status of the various aspects of the Transition It porvides below details for easy reporting.
- State of the added Environments
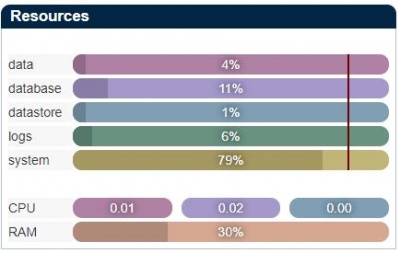
- Tranzman Appliance resources (CPU, RAM, Filesystem) usage
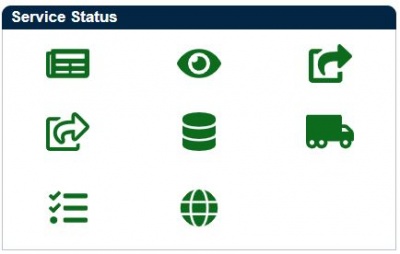
- Service Status
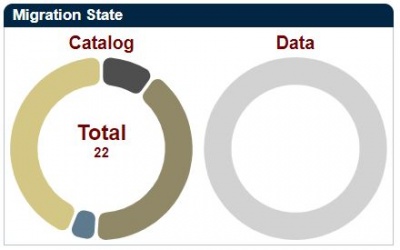
- Graph representation of Catalog Migration status
- Config migration status
- Clients status
Tranzman UI is flexible that it supports majority of Admin operations through UI.
Detailed information can be found below:
Tranzman Resources reporting
This section provides information about:
- Filesystem usage
- CPU usage
- RAM usage
Environments reporting
This sections provides all the added backup environment related components such as Number of backup images,#Img Count, amount of backup data #Size Protected(TB), platform etc. It also provides real time state of the Agents added.
Paused
User can pause an environment to prevent the client being assigned NEW actions, but any existing Actions will continue to run before the pause takes effect. Tranzman will also pause an environment during issues with the Agent, or the Action failed with critical error. Resolve the issue / request support assistance and then resume the agent A change in the pause/resume state will be recorded in the Environment History Report along with its date and time.
Hung
The Yellow Triangle shows that an Agent has not responded for more than 1 hour, this could mean that the services are no longer running, or there are hung processes (probably CURL). Terminate hung processes, and/or restart the Agent to proceed with the Transition. A hung agent will also raise an Alert.
Tranzman Service State reporting
This section reports the progress of the catalog migrated (for same vendor migrations) ????
Catalog Migration reporting
This section highlights the state of different services like NFS Service ,Audit service etc. Any red icon in this sections means the service is not running and need to be checked.
Config Migration reporting
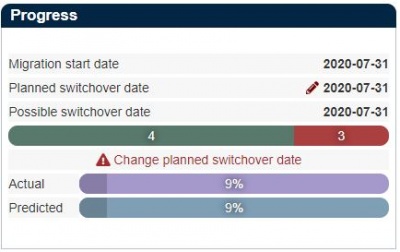
The Progress section has details like migration start date,planned switchover date , possible switchover date based on transfer speed.
Clients status reporting
The Config Migration section highlights the state of Objects(Storage Servers, Policies, Residencies etc.) selected for migration. If selected for migration then you can click and check the state of all those objects i.e. whether they are imported(created on destination master server) or excluded from migration.
Once transition is completed you can jump to the Recovery Documentation section to start restoring the data.
