Reporting and Logging
Headline
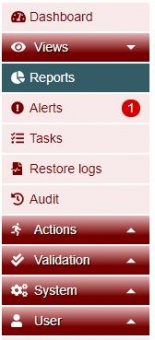
In terms of reporting and logging Tranzman has categorised them in to five sections which can be viewed from Views on Tranzman UI on the sidebar.
Reports
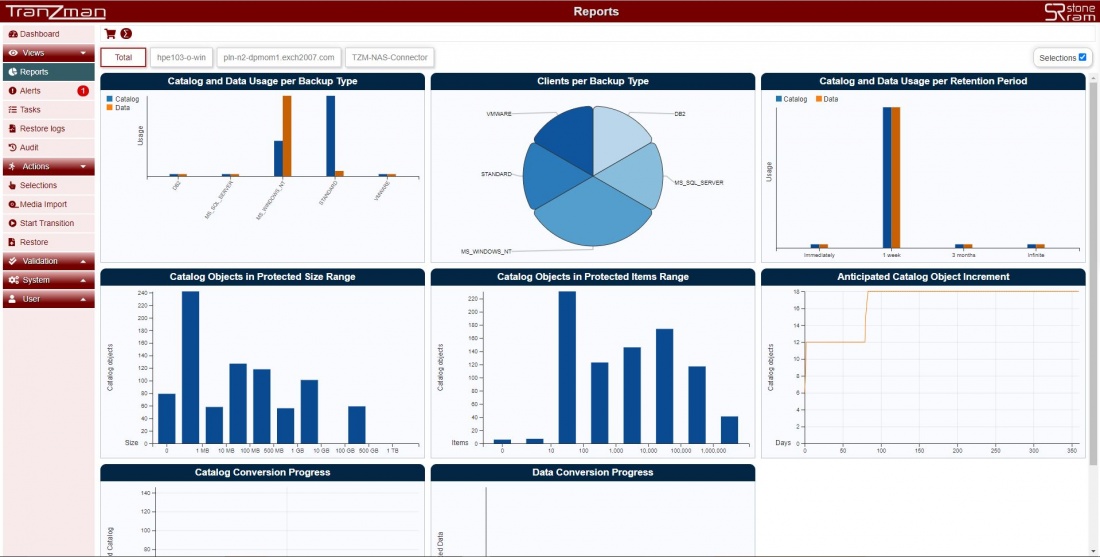
Tranzman Appliance has a reporting feature which is classified further in to different sections.Statistics are displayed as different types of chart.User can choose to see those reports either as for individual environments or for all environments.Click on Views -> Reports to access those charts.On the extreme top right corner there is a button named Selections which is used to control the display of the charts.
![]() will display the charts against data selected for migration.
will display the charts against data selected for migration.
![]() will display the charts against non selected data.
will display the charts against non selected data.
![]() will display the charts against both selected and non selected data.
will display the charts against both selected and non selected data.
Below picture shows the charts against the selected data.
Alerts
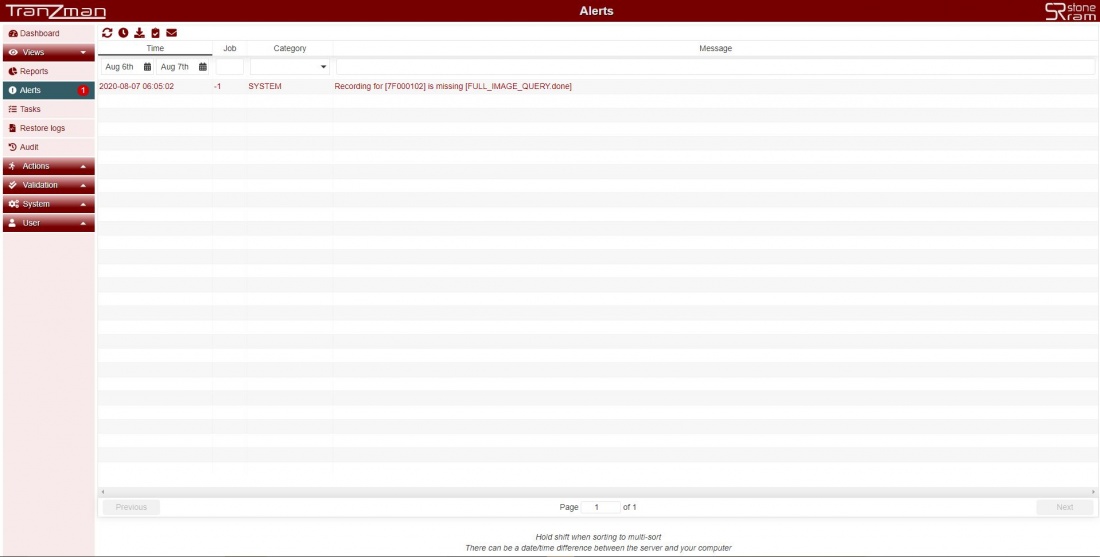
Any errors or failures will be logged under Alerts.
Tasks
Tasks section provides information of all the jobs that has run or are running on the Tranzman appliance.Jobs could be filtered by Environment,Action,State,Job Number. E.g. Below screenshot shows some complete jobs and some waiting for their run on the respective environment.
Restore Logs
Restore specific logs are shown in the Restore logs section. It provides information for :- Image - ImageId used for restore Path - Source data path Device - NFS/CIFS mounted on Appliance for restore New path - Destination path for restore State - State of restore like new,completed,error etc.
Audit
Auditing is enabled by default on tranzman and all the audit related logs could be viewed from Audit section.


